Higher Education v.s. Obesity
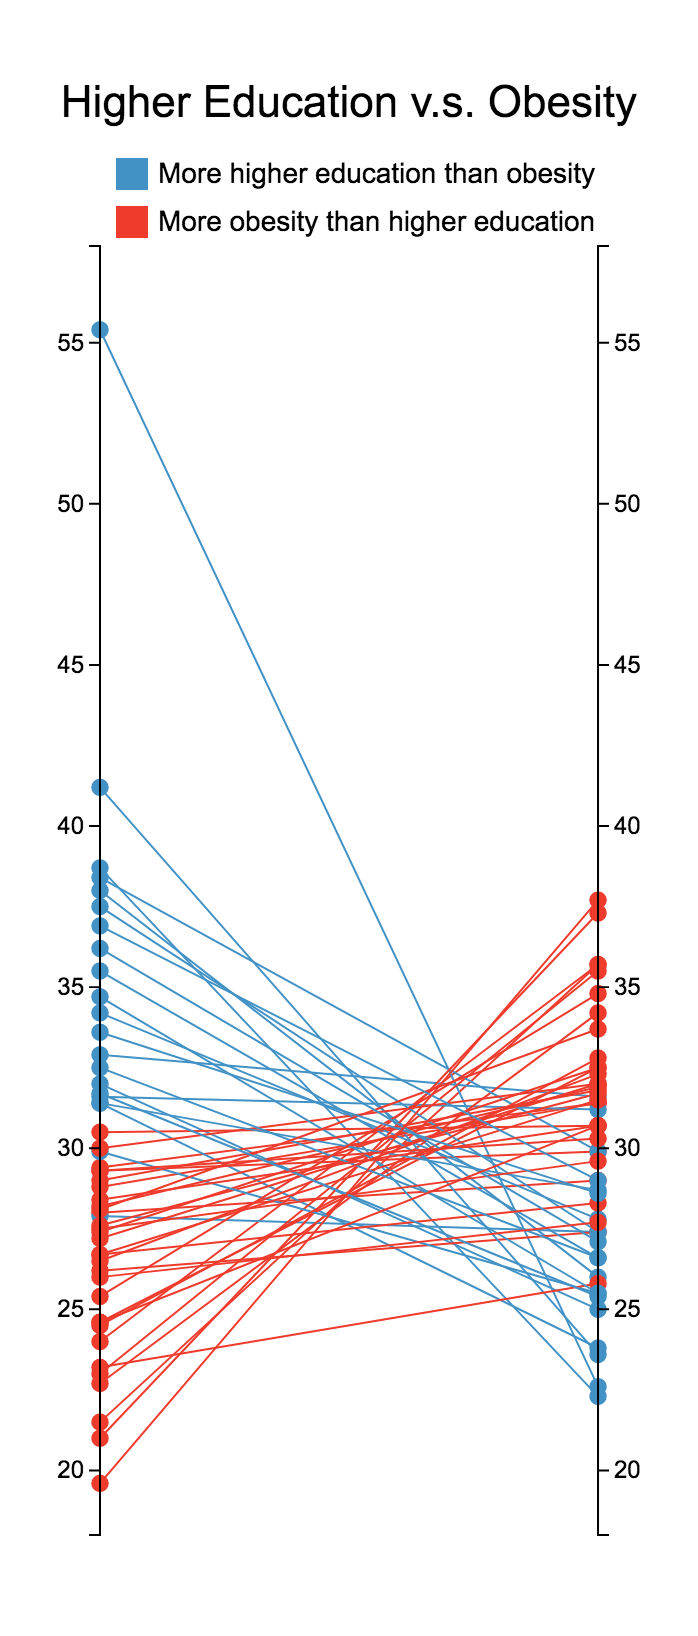
A two-axis parallel-coordinates plot displaying the relationship between higher education rate (left) and obesity rate (right). Each line represents a state in the United States.
Based on a chart featured in Alberto Cairo's book The Functional Art: An Introduction to Information Graphics and Visualization.
Dataset
Obesity data is from "Prevalence of Self-Reported Obesity Among U.S. Adults by State and Territory, BRFSS, 2016"
Education data is from the U.S. Census Bureau, 2012-2016 American Community Survey 5-Year Estimates