Ranking of Carbon Dioxide Emissions
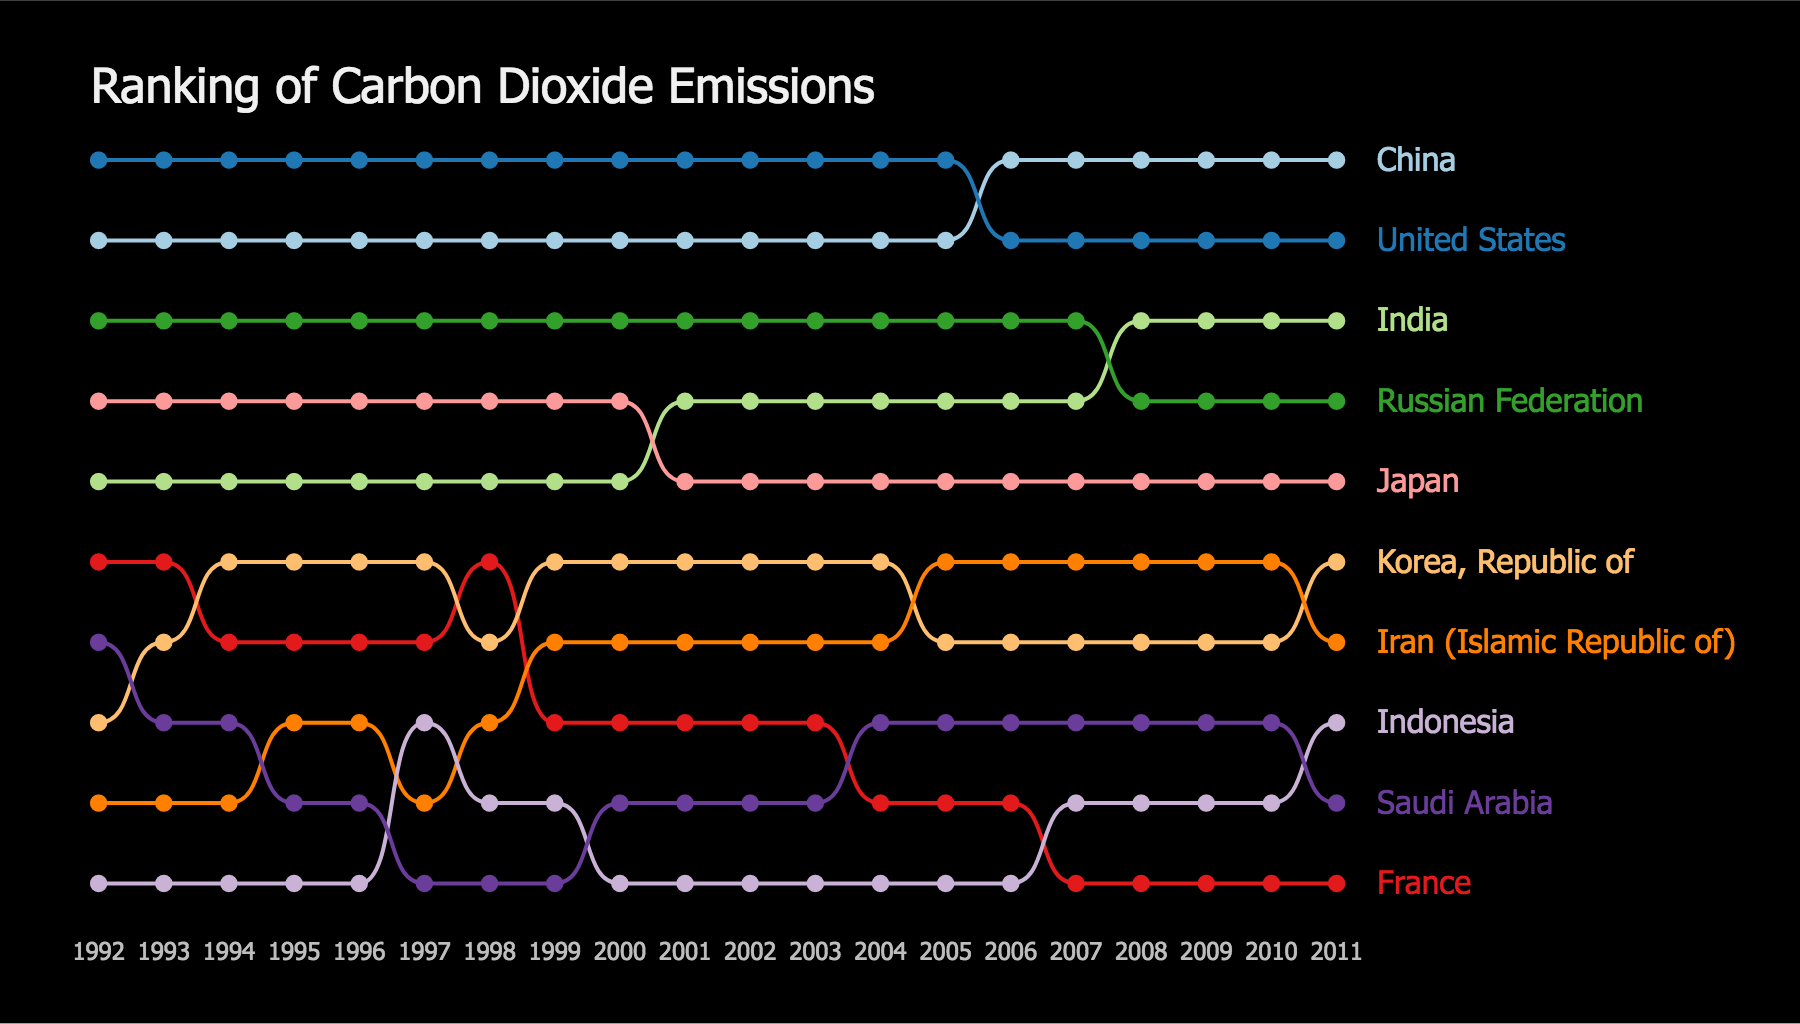
This chart displays the ranking of CO2 emissions of selected countries from 1992 to 2011. Each line represents a country. The vertical position of each dot represents the corresponding country's ranking at that time.
Dataset
Millennium Development Goals Indicators from the United Nations Statistics Division. Accessed May. 4th, 2018.