Boston Weather in a Year
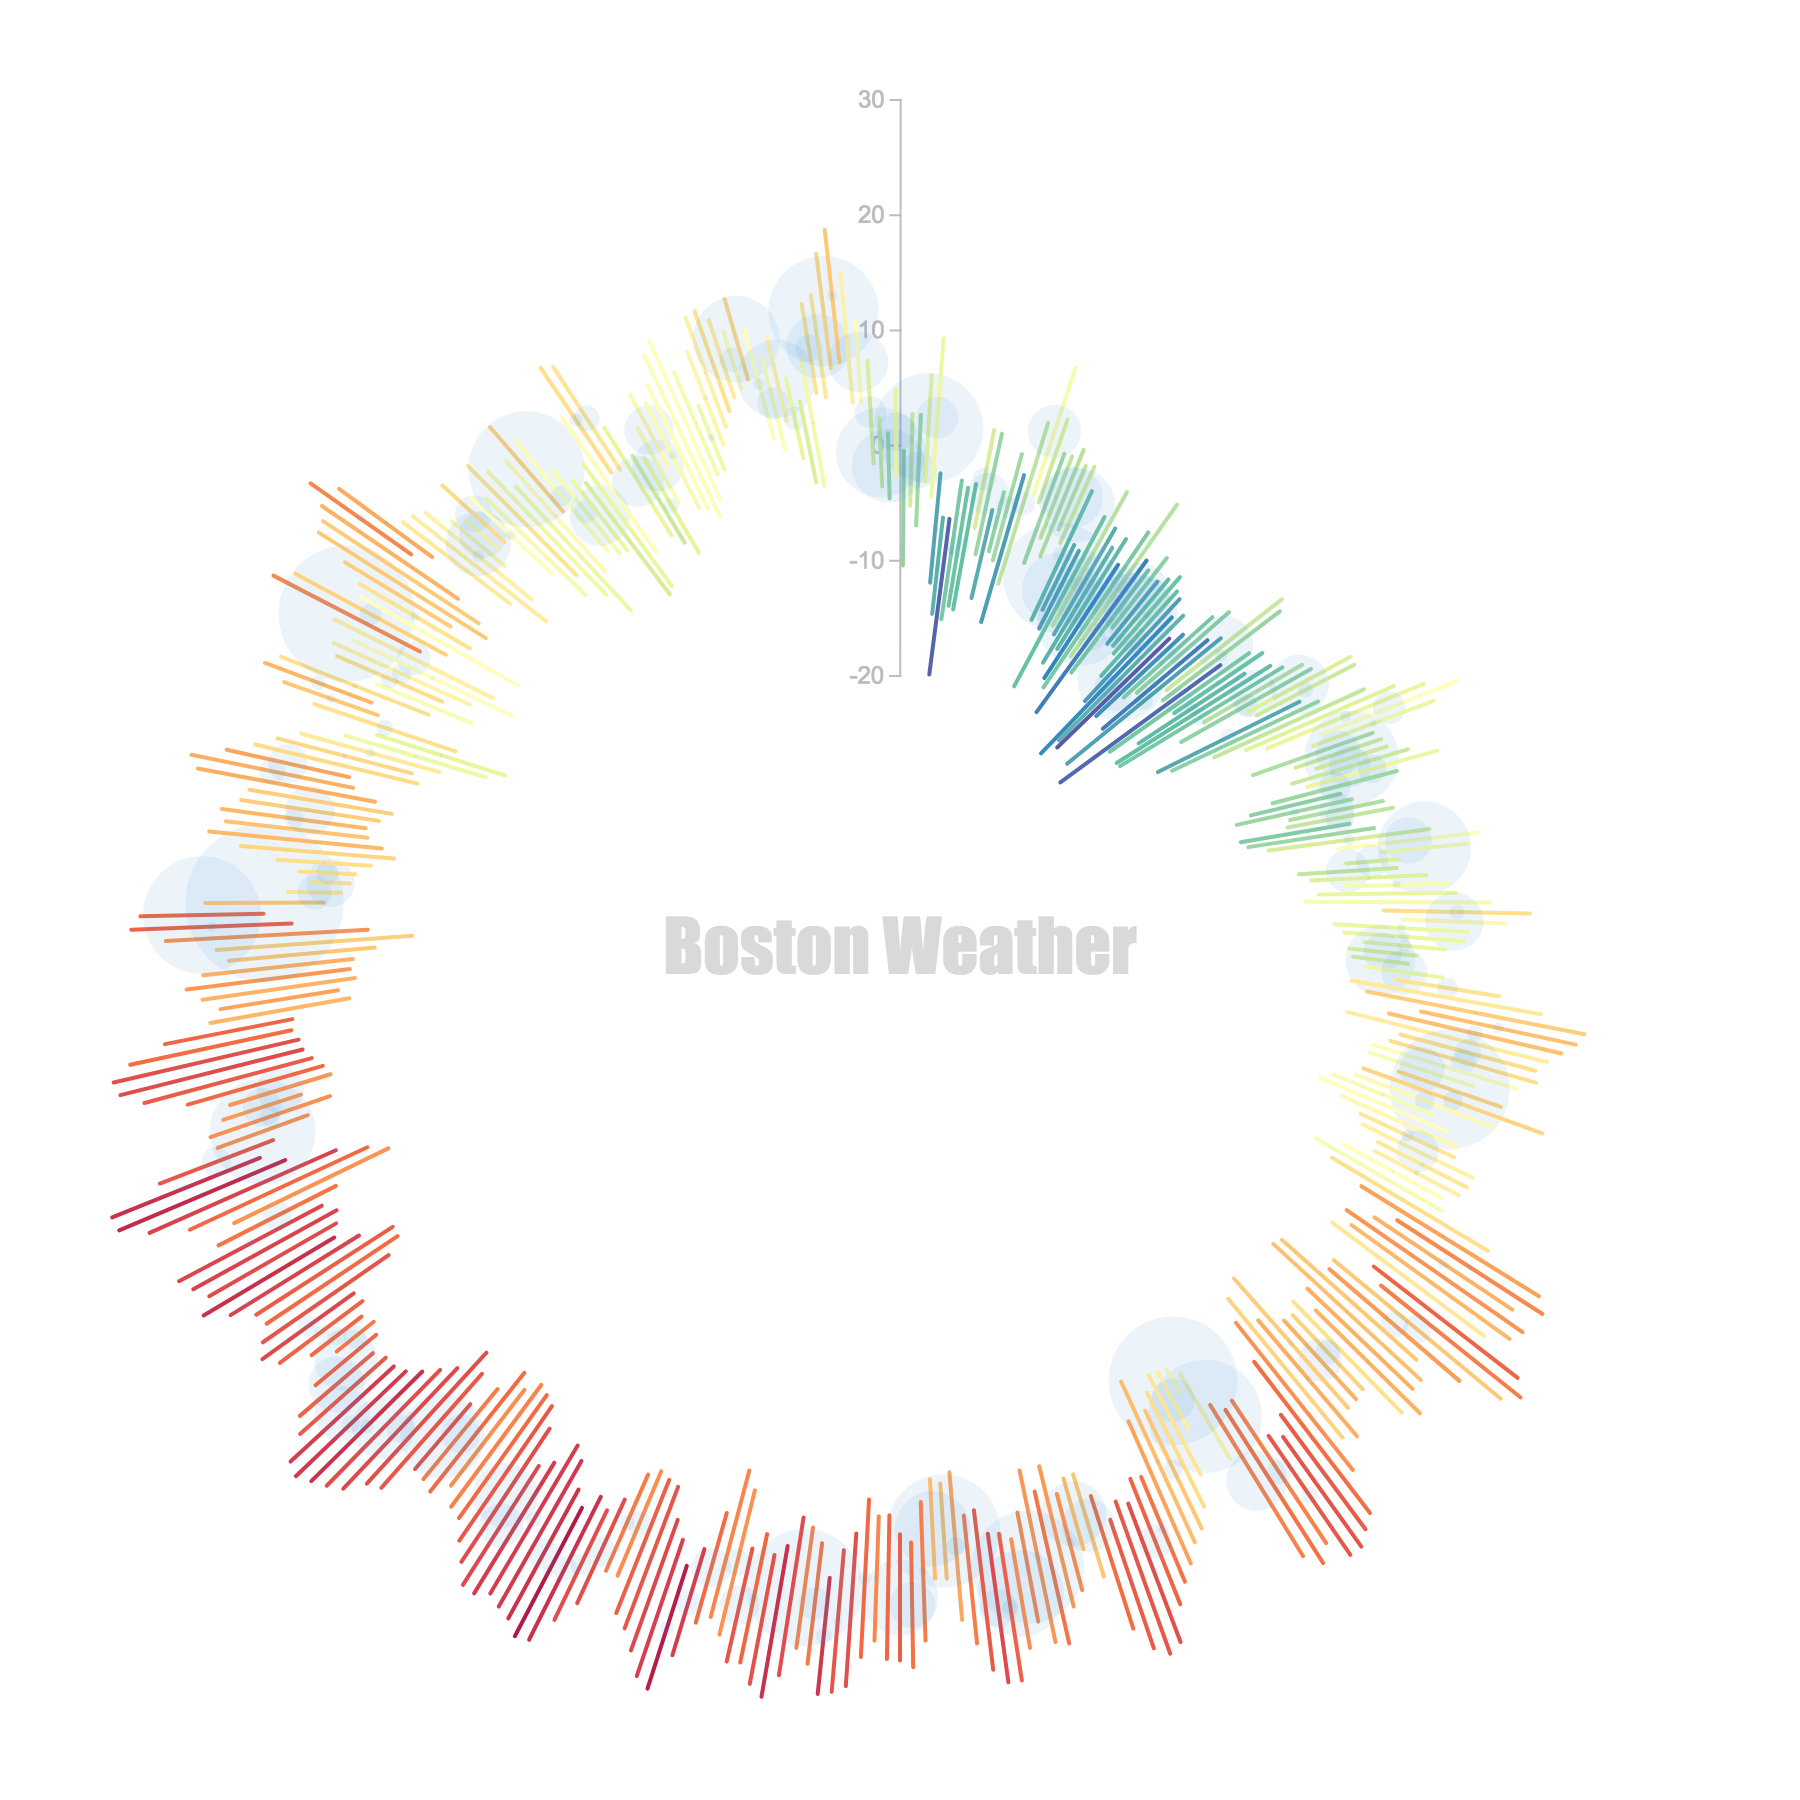
Here we use Charticulator to create a Weather Radial visualization, designed by Raureif GmbH.
A radial chart displaying the temperature and rainfall in Boston over the course of a year. Each line represents a single day's minimum and maximum temperature. Lines are colored by the average temperature. The blue circles represents the amount of rainfall.
Dataset
Boston daily weather data in 2015 including temperature and precipitation
Data collected from the National Centers for Environmental Information; accessed May. 3th, 2018;