Edible Mushrooms
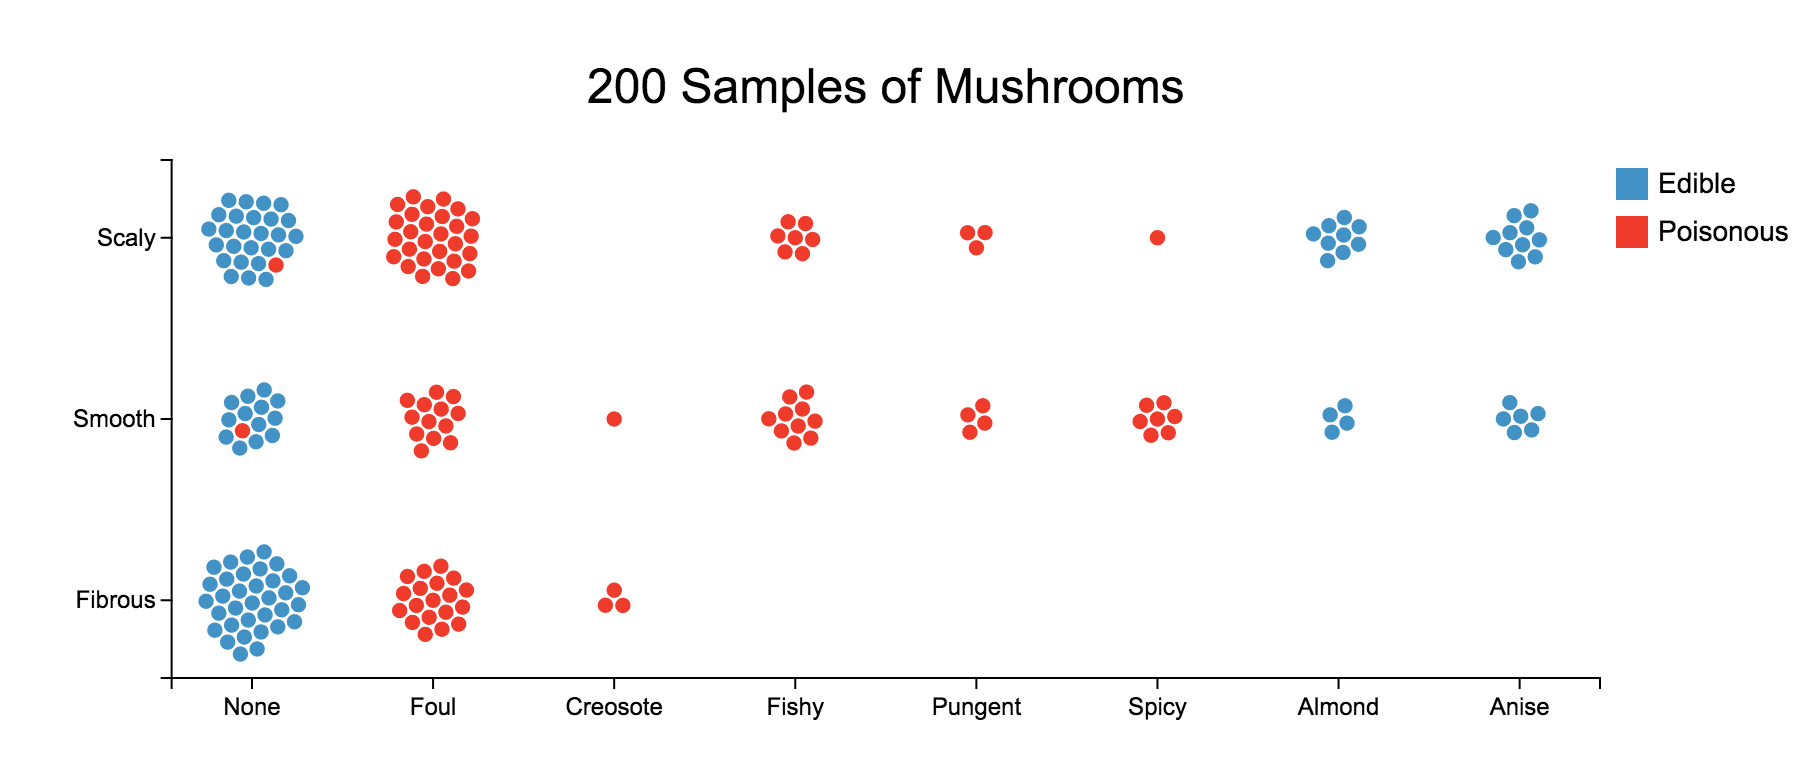
This chart displays the characteristics of mushrooms sampled from the UCI mushroom dataset. Each circle represents a single mushroom sample, colored according to whether it is poisonous. Odors are grouped along the X axis, while cap surface chartacteristics are grouped along the Y axis.
## DatasetThe "Mushroom" dataset from the UCI Machine Learning Repository.
A sample of 200 mushrooms from the original dataset were taken.
UCI Machine Learning Repository: Mushroom Dataset.
Mushroom records drawn from The Audubon Society Field Guide to North American Mushrooms (1981). G. H. Lincoff (Pres.), New York: Alfred A. Knopf