Visual documentations
Some visuals in development phase
Charticulator Visual for Power BI
Charticulator Visual is the no-code way to create custom and reusable chart designs for Power BI.
Charticulator Visual Community
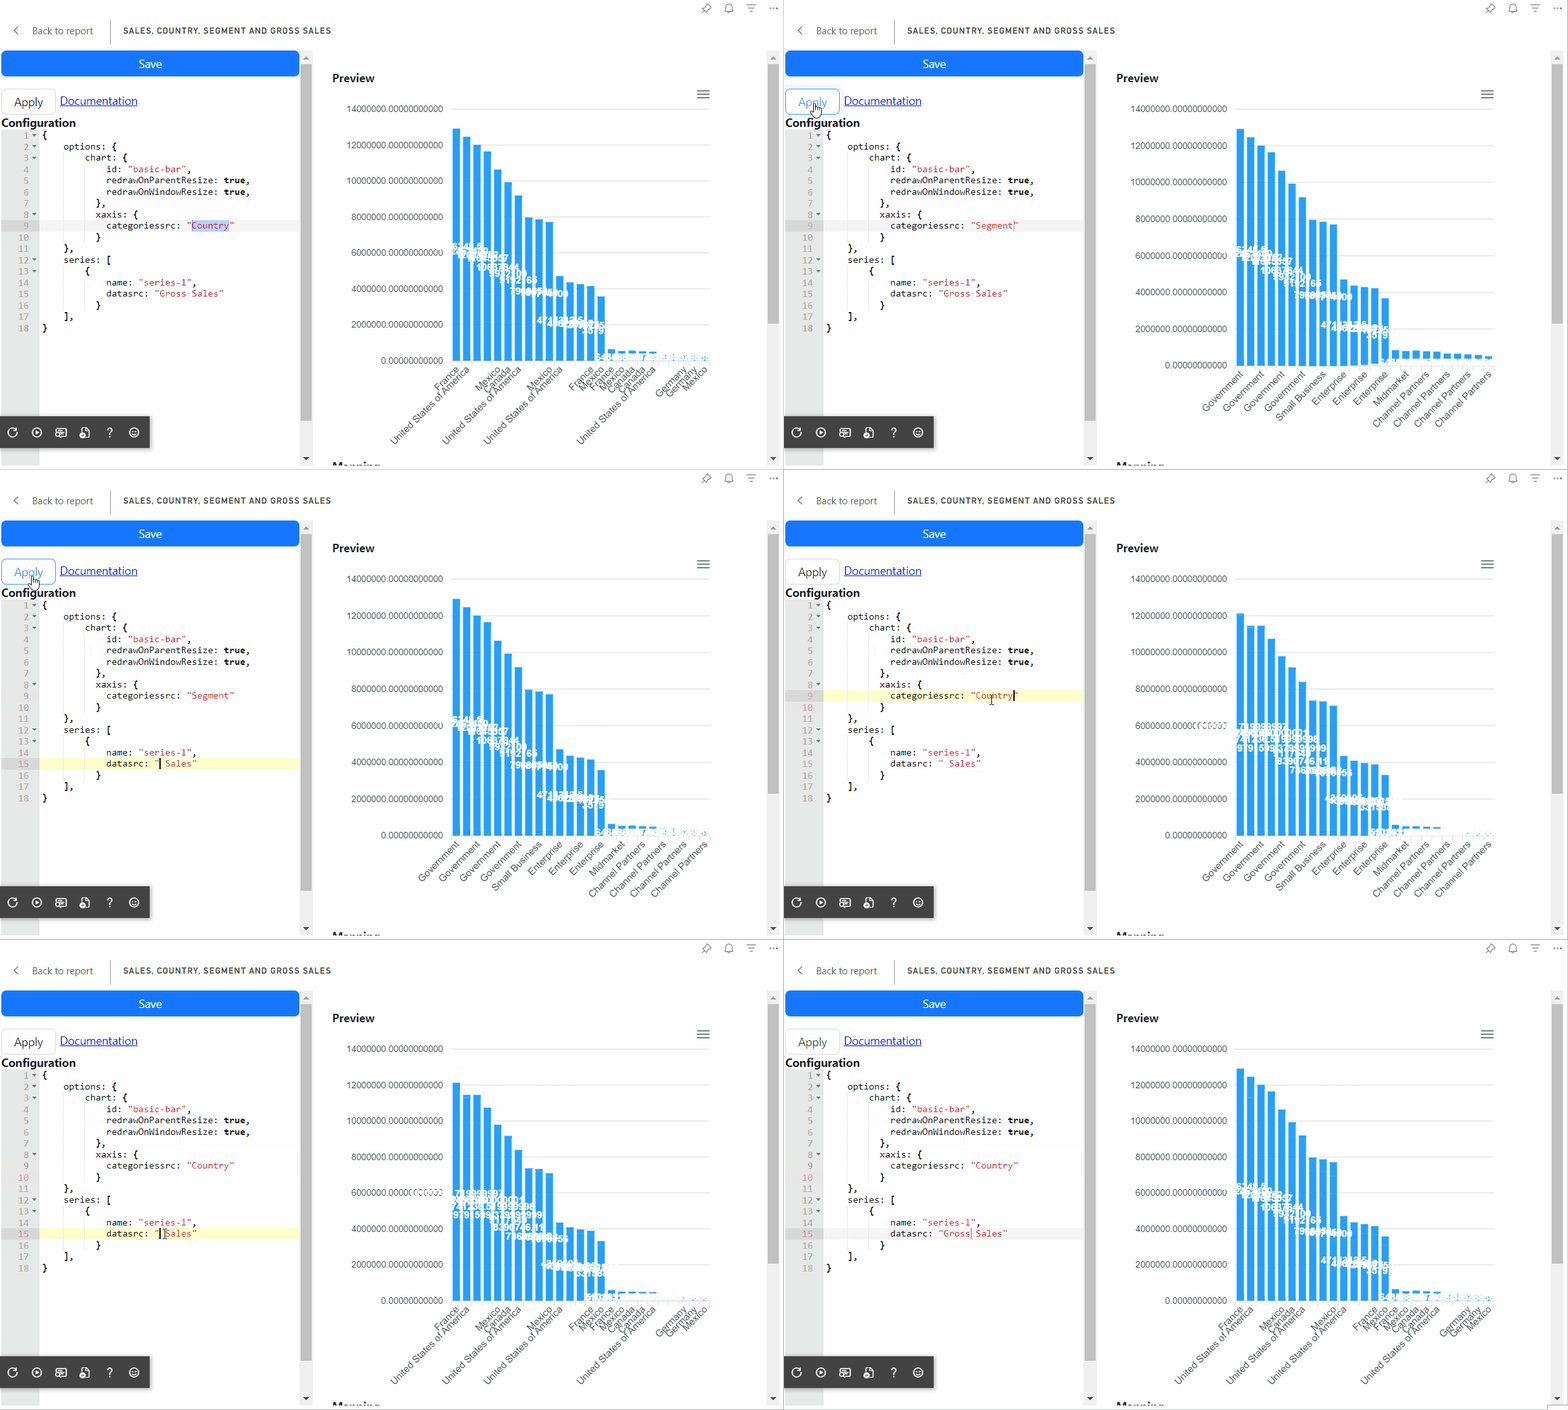
Power BI Visual Editor
The Visual allows you to edit JSON schemas of Deneb, PlotlyJS, HTML/SVG/Handlebars Visual and Charticulator visualizations.
Power BI Visual Editor (AppSource)
Read more about Power BI Visual Editor
HTML/SVG/Handlebars Visual
The visual allows the use of HTML and SVG to layout content in Power BI reports using data from Power BI.
Read more about HTML/SVG/Handlebars Visual
Apache ECharts Visual
The visual integrates the ECharts into Power BI visual. Apache ECharts is an Open Source JavaScript Visualization Library.
Flexible Chart Types
Apache ECharts provides more than 20 chart types available out of the box, along with a dozen components, and each of them can be arbitrarily combined to use.
Powerful Rendering Engine
Easily switch between Canvas and SVG rendering. Progressive rendering and stream loading make it possible to render 10 million data in realtime.
Read more about Apache ECharts Visual
ApexCharts Visual
ApexCharts is a modern charting library that helps developers to create beautiful and interactive visualizations for web pages.
It is an open-source project licensed under MIT and is free to use in commercial applications.
Coming soon...