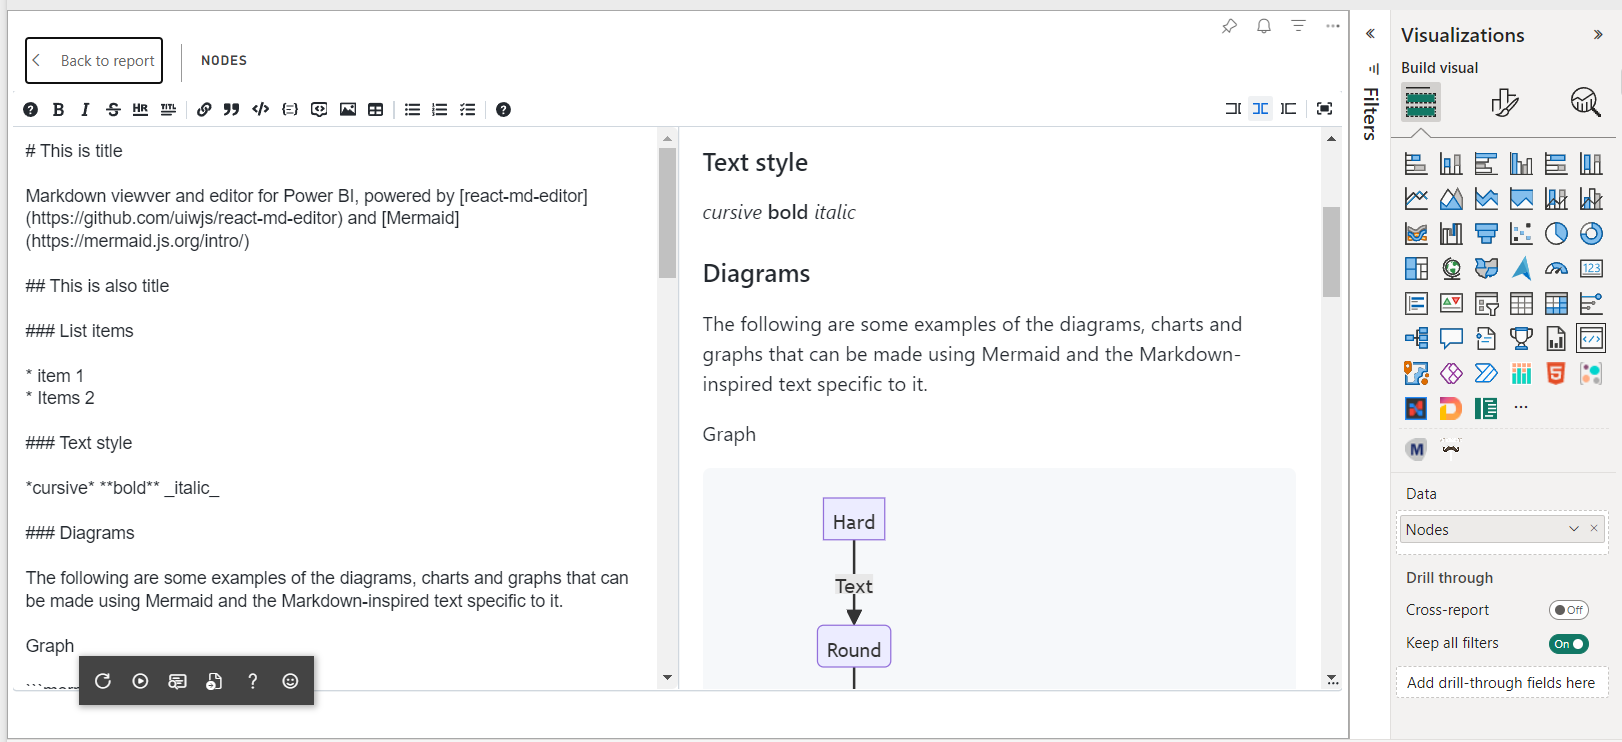
Markdown & Mermaid Diagrams Visual for Power BI – Update 1.4.0
· One min read

Software Engineer
The latest 1.4.0 update of the Markdown & Mermaid Diagrams visual introduces exciting new features and enhancements:
✨ New Features
📌 Custom Styling with the styles Block
You can now define custom styles for text elements using the new styles block.
All content within this block is added as a <style> tag in the final HTML render.
Example:
h1 {
    color: red;
}
This will make all <h1> headings appear in red.
🛠 New Handlebars.js Helper Functions
We've added several new helper functions for the Handlebars.js templating engine, including:
- Equal (
eq) - Not Equal (
ne) - Less Than (
lt) - Less Than or Equal (
lte) - Greater Than (
gt) - Greater Than or Equal (
gte) - Logical AND (
and) - Logical OR (
or)
📖 Read the full Handlebars.js helpers documentation →
🔍 Improved Debugging: View Source on Render Failure
If rendering fails, the visual now displays the source configuration of the chart. This helps you quickly identify and fix any issues.
⚡ Increased Diagram Rendering Limit
The maxEdges configuration parameter has been set to 30,000, allowing the visual to render diagrams with up to 30,000 nodes.