Getting Started
The visual uses Handlebars.js to render template and bind data from Power BI. Read mode about Handlebars.js before start.
Download the visual or sample report file on Appsource page
Power BI Visual Editor can be used for editing HTML/SVG content with autocomplete and syntax highlight
Or prepare your own dataset.
Follow the Step by step guide to create simple bar chart example:
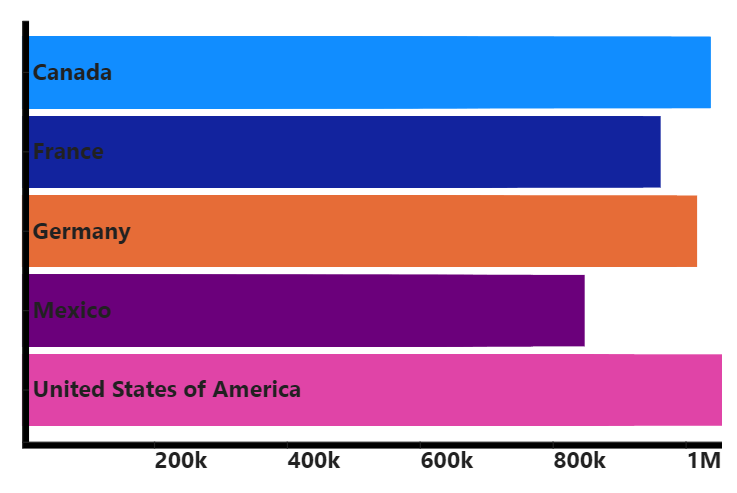
Full template:
{{ var 'margin' 30}}
{{ var 'svgHeight' (sub viewport.height (val 'margin'))}}
{{ var 'chartHeight' (sub viewport.height 90)}}
{{ var 'svgWidth' (sub viewport.width 30)}}
{{ var 'rectHeight' (divide (val 'chartHeight') table.rows.length)}}
{{ var 'sales' (map ' Sales' table.rows) }}
{{ var 'countries' (map 'Country' table.rows) }}
{{ scaleLinear 'Scale X' (array ( min (val 'sales')) ( max (val 'sales'))) (array 0 (val 'svgWidth'))}}
{{ scaleBand 'Scale Y' (val 'countries') (array 0 (val 'chartHeight'))}}
{{ axisBottom 'axisMeasure' 'Scale X' }}
{{ axisRight 'axisCategory' 'Scale Y' }}
{{ setupScale 'Scale Y' 'paddingOuter' 0.2 }}
{{ setupScale 'Scale Y' 'paddingInner' 0.1 }}
{{ setupAxis 'axisMeasure' 'tickFormat' '~s' }}
{{ setupAxis 'axisMeasure' 'ticks' 5 }}
<svg width="{{val 'svgWidth'}}" height="{{ val 'svgHeight' }}">
    <g transform="translate({{val 'margin'}}, {{val 'margin'}})">
        <g>
            {{#each table.rows}}
            <rect
                x="0"
                y="{{{ useScale 'Scale Y' this.Country }}}"
                width="{{{ useScale 'Scale X' this.[ Sales] }}}"
                height="{{{ getScale 'Scale Y' 'bandwidth' }}}"
                fill="{{{ useColor this.Country }}}">
            </rect>
            {{/each}}
        </g>
        <g transform="translate(0, {{val 'chartHeight'}})">
            {{{ useAxis 'axisMeasure' 'Scale X' }}}
        </g>
        <g transform="translate(0, 0)">
            {{{ useAxis 'axisCategory' 'Scale Y' }}}
        </g>
    </g>
</svg>
<style>
    .tick text {
        font-size: 20px;
        font-weight: 700;
    }
</style>
Handlebarsjs defined context
table - contains data from Power BI in table structure.
table.rows - contains rows content from Power BI as JS objects.
Usage:
{{#each table.rows}}
    <text>
        {{ this.Country }}
        ...
    </text>
{{/each}}
Prints the list of country names in Country column.
Where Country is column name assigned to the visual.
table.columns - contains list of columns from Power BI.
Usage:
{{#each table.columns}}
    {{this.displayName}}
{{/each}}
viewport - contains visual viewport size
viewport.height - height of viewport
Usage:
{{ viewport.height }}
viewport.width - width of viewport
usage:
{{ viewport.width }}