
7 posts tagged with "Charticulator"

View All Tags

Charticulator Gallery

· One min read
Ilfat Galiev
Software Engineer

The Charticulator App now has a built-in list of charts (gallery) that can be imported with a single click.

Gallery

There are only few examples in the diagram list so far, but it will be updated soon, and will also support importing templates. If you want to add your own examples, feel free to contact me.

Chart filter

The list of charts has a filter of charts by name and type (private, charts that are stored in the browser's indexed database, and public, which are downloaded from a CDN).

Polygon mark in Charticulator

· One min read
Ilfat Galiev
Software Engineer

The new feature for Charticulator

This is one of the most significant updates for Charticulator. The mark allows to draw arbitrary shape for data visualization. The polygon support snapping to other marks or parent objects and supports basic styling like rectangle, ellipsis or triangle marks.

polygon

The mark doesn't have a icon yet. But already available for testing in application on https://ilfat-galiev.im/charticulator/ page.

Current limitations:

  • The mark doesn't have internal constraints (no middle points like in line mark)
  • Rendering in polar coordinates has not implemented yet

Charticulator upcoming updates

· 2 min read
Ilfat Galiev
Software Engineer

Power BI Certification

The Charticulator Visual Community (View) has passed the certification and will be available for end users in 2-3 weeks.

The Charticulator Visual Community (Editor) shows notification in toast when chat saves in visual settings.

Popup toast notification

Scale editor popup

Issue with scale editor popup on click on scale has been partially fixed. When user clicks on scale name on Scales list panel editor opens Scale editor.

Scale editor popup

Columns highlight fixed partially

The visual passed highlight columns correctly. Highlight controls was added into visual settings.

Highlight settings

The visual enabled the highlight settings for editor if template contains highlight columns.

Highlights demo

TODO: need to implement case when highlight disabled and visual doesn't filter category values.
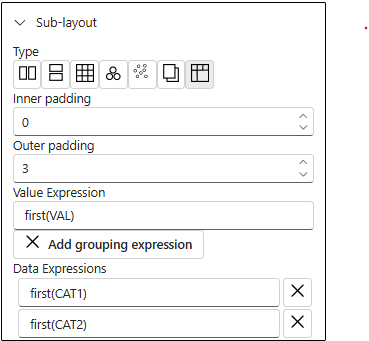
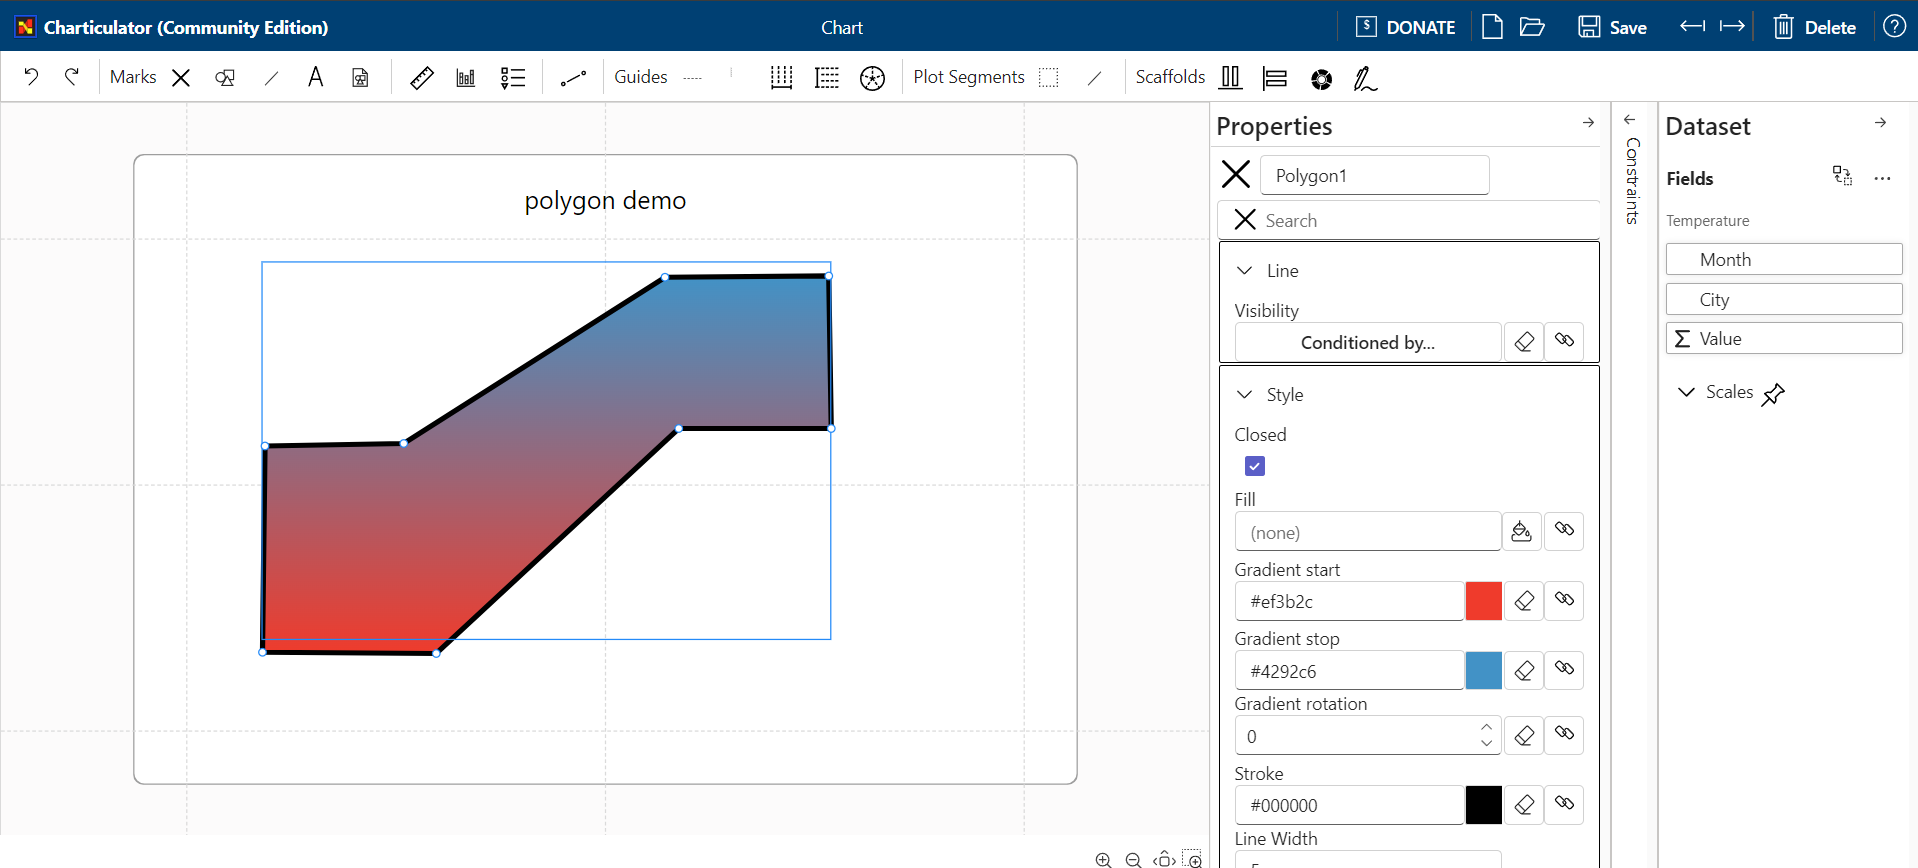
Attribute panel

Attribute panel has border lines for each group of properties.

Attribute panel

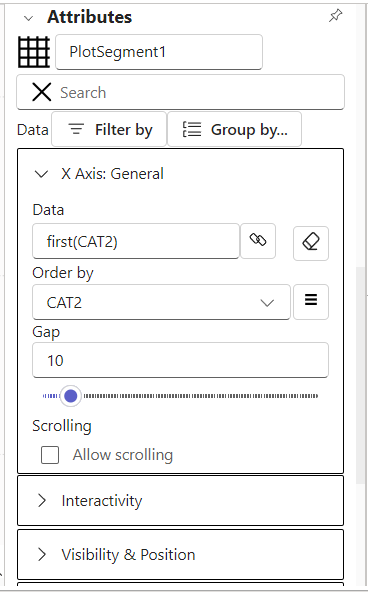
Fixing issue with sorting axes data in plot segment

The sorting axis value by another colum works now

Sorting demo

Importing chat templates fixed

The visual supports importing templates in edit mode.

Import button

Import demo

Bind data button icon

The icons of data binding button has been fixed

Bind data button

The issue, when chart attributes doesn't filters properly, has been fixed

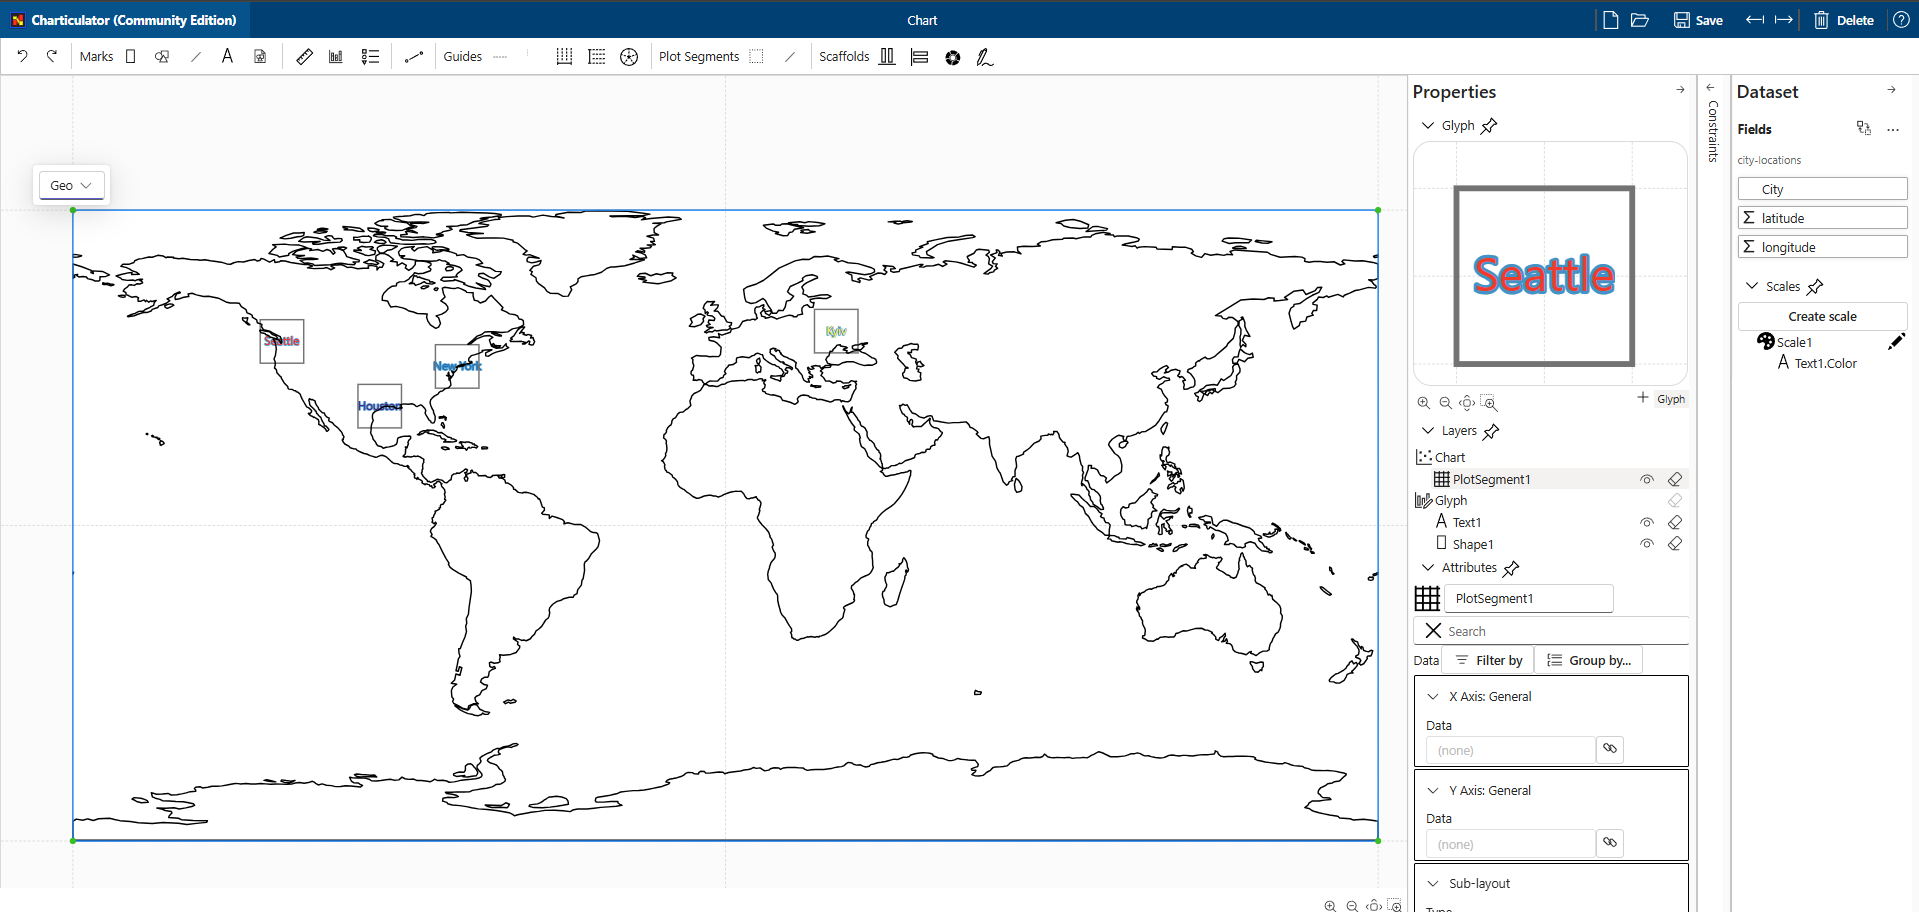
Dataset and Glyph/Attributes panels are collapsible

It brings more space for editing the chart. Data can be bind to properties on Attributes panel. It's not necessary to have Dataset panel always visible
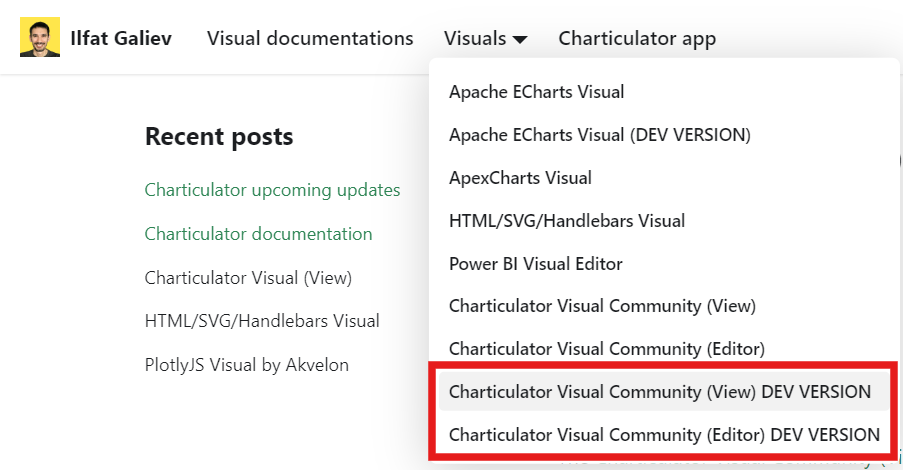
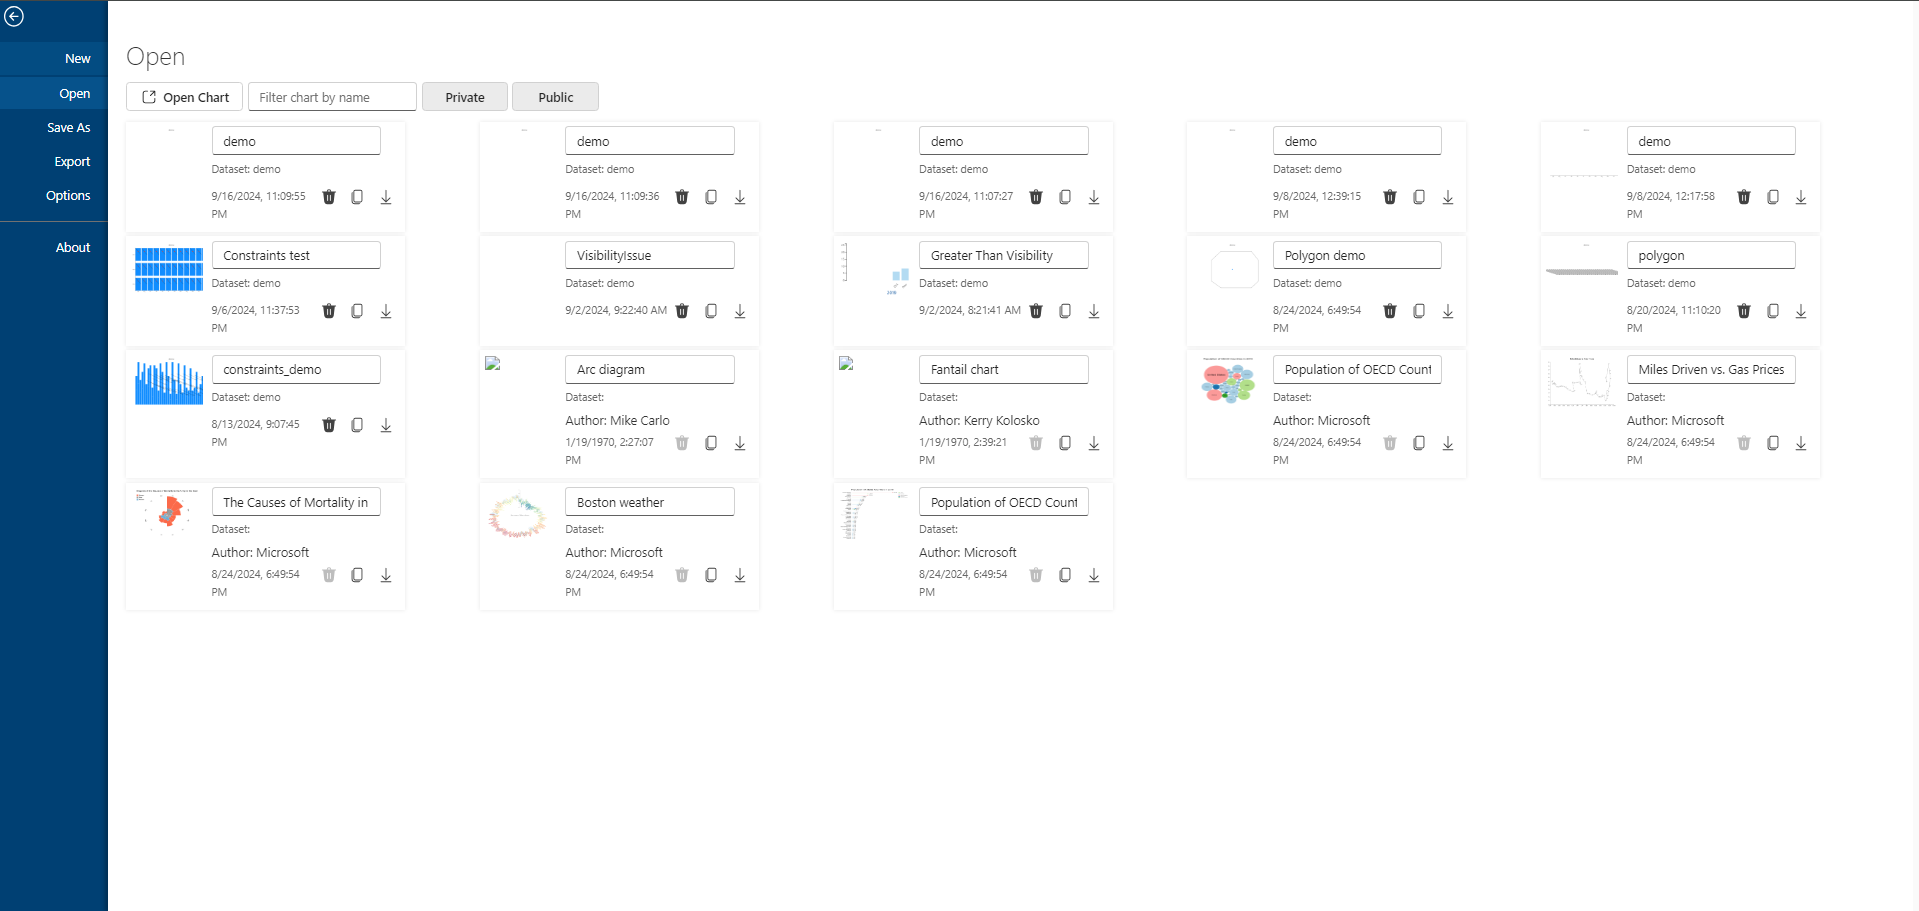
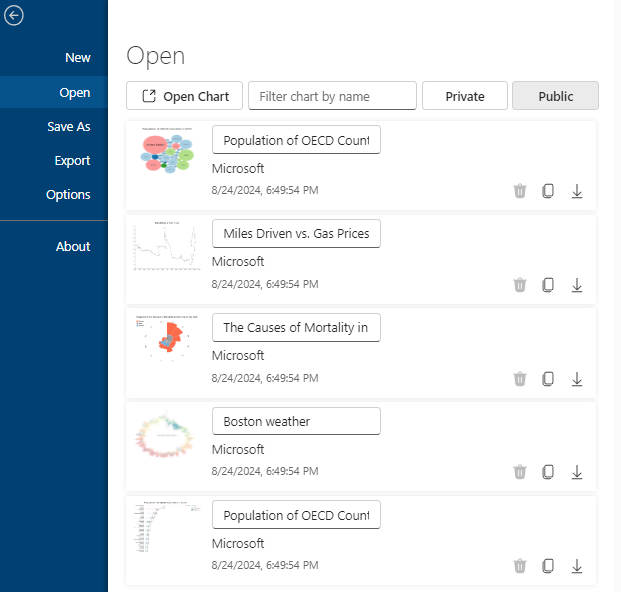
Collapsible panels

Downloads

You can download the latest development version in Visuals menu of blog

Visuals menu

Charticulator Visual (View)

· 2 min read
Ilfat Galiev
Software Engineer

The first version of the visual for rendering Charticulator templates has been published in AppSource

AppSource search result for Charticulator word

The editor version of the visual available on GitHub repository page or by direct link

Getting started

To use the visual, you need to create a new chart using either the old Charticulator or a visual with an editor, or import a template that you have (or took from https://charticulator.com/gallery/index.html).

You also can use The New Charticulator App to create chart templates.

The New Charticulator App

it's not recommend to use Old Charticulator App because it doesn't include new features and bug fixes.

To import the template, create instance of the new visual, assign data from Power BI and switch the visual to edit mode by click on "Edit" on visual menu. You should see button to import the template, click on it and select template file. The visual saves the template in settings immediately.

Importing template

Click on "Back to report" to exit from edit mode.

The visual shows the chart built from template if the visual has all data for template, otherwise it requires to provide columns mapping between data columns and template columns. In this case set column mappings and confirm by clicking on "Confirm".

Mapping Power BI columns to template columns

After that visual should show the chart built from template and data assigned from Power BI.

Visual sample

To build the chart from scratch, create instance of the visual and assign data, then switch the visual to old Charticulator visual or to the new Charticulator with editor.

After that click on "Edit" in visual menu to switch the visual to editor mode, it launches the Charticulator App for plotting new chart.

Save the chart and close editor by click on "Back to report", the editor version of the visual will show preview version of chart.

To save the chart switch back to the view version of the visual and save a report. The visual with editor will not work in Power BI services in view mode of the report.

Switching the visual to View version

Next steps

If you have an idea or suggestions, feel free to open a discussion on the GitHub repository page

Charticulator app deployment

· One min read
Ilfat Galiev
Software Engineer

Since the version of Charticulator from Microsoft is retiring, I decided to deploy to GitHub Pages the latest version with fixes and some new functionality. Unfortunately all this new stuff is not included in the Power BI Visual. In the next 2 months I plan to prepare alternative versions of visuals.

Charticulator app

The first stage is practically accomplished. In which I upgrade the UI library to Fluent UI 9. Since the first version doesn't work with React 18+ fully.

The upcoming work is fixing critical bugs in the current version of the visual, which block the implementation of the full cycle of chart development in the Power BI report.

Charticulator visual

· 2 min read
Ilfat Galiev
Software Engineer

It past a year after the first attemp to give breath Charticulator visual. I didn't get any feedback on the first version at the time, neither bad, good, or error message, but they were there.

Here's a second attempt. I will have the opportunity to publish a version on AppSource, I think it should help to find the old audience.

I forked the Charticulator source to my repository on GitHub, which is used internally by the new visual.

https://github.com/zbritva/charticulator

It already contains fixes and features that were not included in the original.

Editor is avialable for preview on https://ilfat-galiev.im/charticulator/.

And, yes, there is no httpS. Do not use for production

The source code for the new visual has been published on Github:

https://github.com/zBritva/charticulator-visual-community

The main difference from orginal Charticulator

The visual will be split into two parts. The first includes the Charticulator editor UI. The second includes only engine to render charts.

Report authors will have to use one visual to edit the chart and switch to the second visual before saving the report.

This approach allows:

  • significantly decrease the package size.
  • easier to obtain certification for the second, because less code for review.
  • Keeping the first (editorial) version uncertified opens your hands for more technical possibilities, (downloading from the gallery or moving part of the editor code to CDN and so on).

Community

Fell free to open any discussion on GitHub, even it is about closing.

The road map is stabilization and close workflow of the visual. Then submitting the first versions to AppSource.